soundmagixsongs screenshot

This project is basically a music website where completed music records are uploaded for users to buy online from anywhere in the world.

Sound Magix SongWriters is a website that was converted from a static HTML, CSS & JavaScript website to a WordPress website based on my client's needs which is making it easy for him to be able to upload recorded music online, but due to the limitations on what a website owner can do in terms of customizing the WordPress themes, so I suggest to him that I build a custom theme tailored to his needs and objectives for the website.
Plugins were reduced to barest minimum, a plugin is only installed when it serves an actual purpose and the use of it will make website development process smoother and faster. The for this reason is to avoid too many unnecessary load on the website which can hurt the loading speed of the website, and also some plugins are not updated consistently as at when due, and this can cause a major issue on how the website functions.
The Advanced Custom Fields(ACF) plugin was installed to make it hassle free for the website owner to be able to add content to website anytime by just typing into form fields.
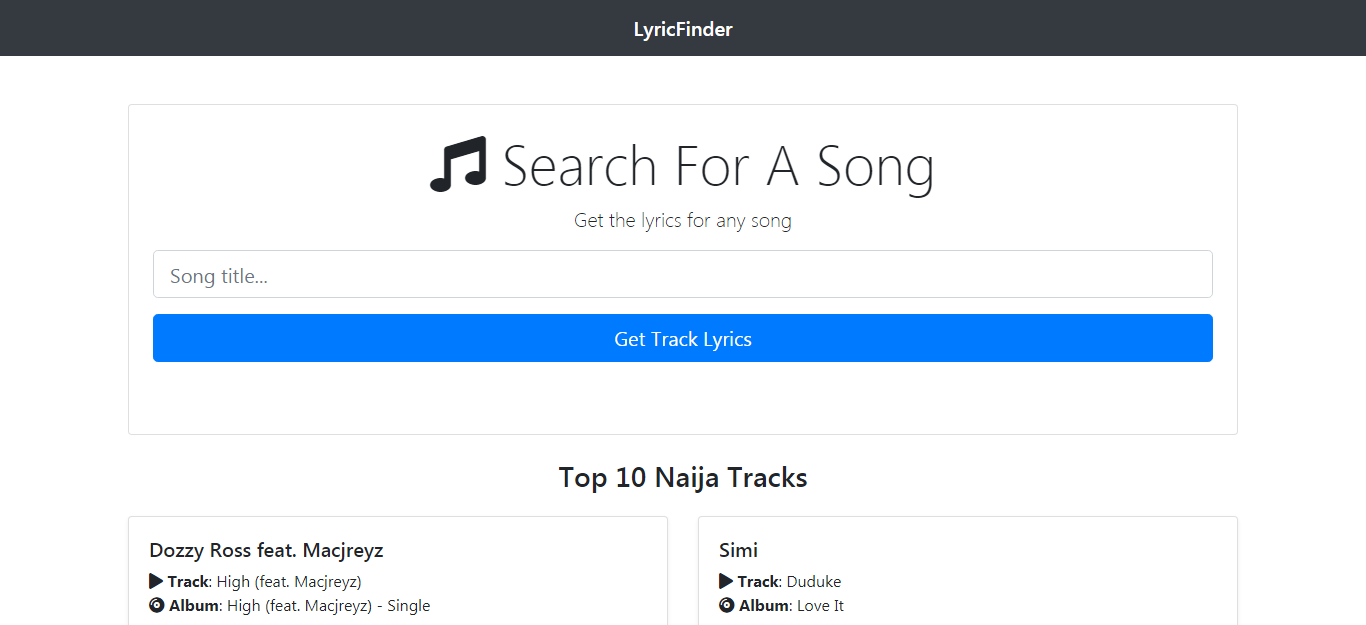
Paystack Payment gateway API was integrated into the website to allow users to pay for any song they like after listening to the first 20 seconds of the song. When a user's payment for a song is successful, the user gets an email containing the receipt of the transaction, while the website owner gets paid in his Paystack account confirming a successful transaction at his own end also, afterwards the owner sends the song to the user.
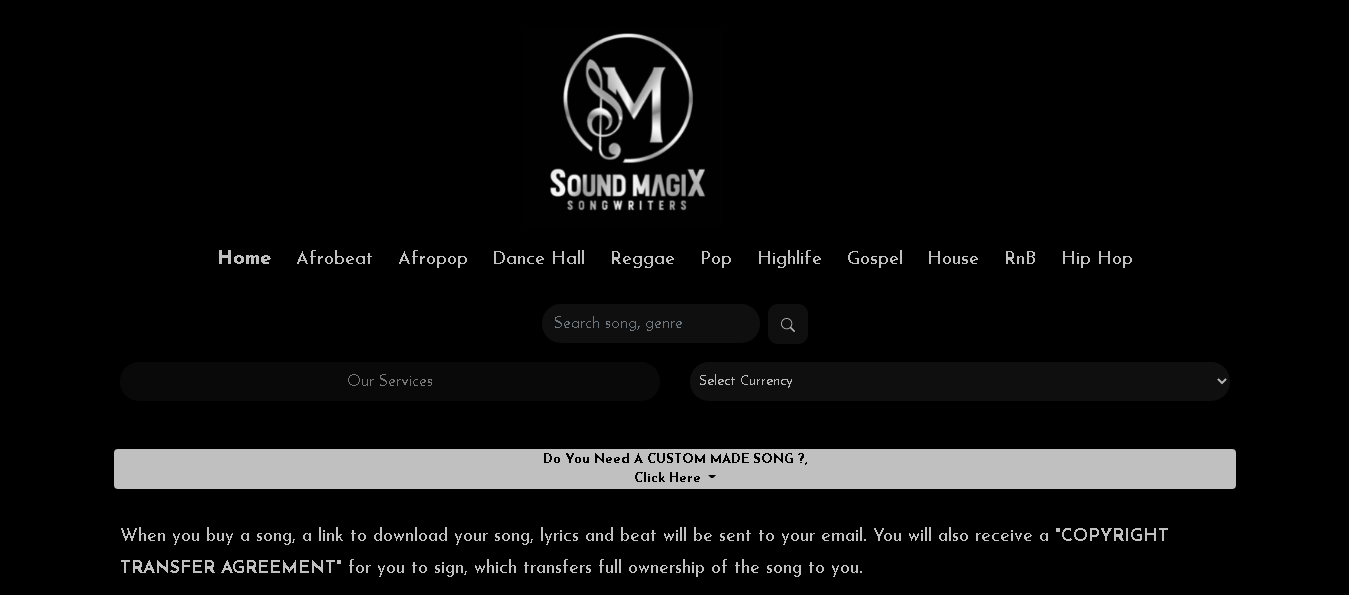
ExchangeRate API was also integrated into the website to create a currency converter functionality which works with a select form field that drops down to display Nigerian Naira and US Dollars, based on the one that is selected the corresponding song price is converted accordingly.

Project Info

Sound Magix SongWriters WorPress is a music-themed website that display an array of songs with different genres(Afrobeat, Afropop, Pop, RnB, Hip Hop etc) and songs can be grouped together in a page according to the navigation menu that is selected.

  • Type of Project: Custom WordPress Website
  • Project: Sound Magix SongWriters
  • Website: soundmagixsongs.com
  • Completed: March 2021
Hacker News App

This project was created with goal of refining my testing skills with Jest and Enzyme, and also to work with the amazing Hacker News API.

Hacker News App is a React web application created to display top quality articles, posts and books by tech industry experts.
API data was consumed using axios library, then the returned data was mapped over to display a table via Table component instance with table haeding of Title, Author, Number of comments, Number points for each article. A Dismiss button component was also created to allow user to delete any article /post/ebook.
Users can also search for a particular article/post/ebook through search term typed into the search and this is handled both on client side and server side with the search query.
More content can be loaded from the backend when user clicks the More button via the paginated fetch functionality that allows only 100 contents to be loaded per fetch from the API data. Snapshot testing was implemented using Jest to ensure any changes to code are updated and bug-free, also integration testing was added using Enzyme to ensure a robust and stable application.

Project Info

Hacker News Clone App is a web app made with React and working with the Hacker News API.

phenomenal furnitures screenshot

This project was created to gain some experience in building a full-fledged ecommerce website application for clients with the need for a fully functional ecommerce store.

Phenomenal Furnitures Store is a web application built with basic pure HTML, CSS and JavaScript, an ecommerce store to display all sorts of unique and phenomenal(hence the name) furnitures, whether it be bed, couch, armchair, sofa, work desk etc.
The code base features a lot of object-oriented programming, this is to ensure that some particular chunk of code are reusable. Classes for getting and displaying the products, also local storage to save any actions (add to cart, remove from cart, increase item in cart) taken to the local storage so that data persists when the page is reloaded.
Most of the reusable chunk of code were methods that can achieve the same objective for different functionality.
Contentful was used as the backend content management system to store all the various furniture contents, making it super easy for the owner of the ecommerce of the store to be able to add furnitures with its title, image and price, this is possible by just typing the name of the furniture as title, uploading the image, and typing the price, the content model is already setup, so the owner doesn't have to do much to add new content to their ecommerce store.
Async/await isused to get the content entries via the contentful API, where items are retrieved then displayed on the page via destructuring.

Project Info

Phenomenal Furnitures Store is a web app made with HTML, CSS & Vanilla JavaScript and displaying content entries using the Contentful API.

visualize heatmap screenshot

This project is one of the freeCodeCamp data visualization project challenge to display(visualize) data via multitudes of models used to visualize data for data scientist, statiticians, economists, weather forecasters, models like bar chart, pie chart, scatterplot etc.

Visualize With Heat Map project was built using a javascript library called d3.js(Data-Driven Document ), which sole purpose is to visualize data.
A svg element was added to the HTML document which serves as a canvas to draw the heat map data, a d3 object was used in combination with a select method to gain access to the svg element, afterwards an AJAX request was then established by creating a new XHR(XMLHttpRequest) object to be able to retrieve data from a url provided by freecodecamp.
Width and height dimensions for the svg canvas was added using the d3 attr() method, then scales are generated for both the x and y axis so that the incoming data(data on global temperature from 1753 to 2015) to be visualized can fit in perfectly in the svg canvas, the x-axis features all the years, while the y-axis features the months in each year.
The rectangle cells that will visualize the actual data is filled with different colors based on the range of the variance value of the temperature data coming from the url.
The x and y axis is now drawn taking their respective scale values as an argument. A tooltip is also added in such a way that when a user hovers over any rectangle cell, all the data for that cell displays.

Project Info

Visualize With Heat Map is a web app for data visualization made with the d3.js(data document driven), a javascript library created to display data for visualization purposes.

  • Type of Project: freeCodeCamp Visualization Project Challenge
  • Project: Visualize With Heat Map
  • Website: visualize-heatmap.netlify.app
  • Completed: April 2021
visualize choroplethmap screenshot

This project is one of the freeCodeCamp data visualization project challenge to display(visualize) data via multitudes of models used to visualize data for data scientist, statiticians, economists, weather forecasters, models like bar chart, pie chart, scatterplot etc.

Visualize With A ChoroPleth Map project was built using a javascript library called d3.js also known as D3, an acronym for Data-Driven Documents that produces dynamic, interactive data visualizations in the web browser, basically its sole purpose is to visualize data for statisticians, economist, mathematicians, data scientist to make sense of the data.
As opposed to generating a scale for x-axis and y-axis like other data visualization models, choropleth maps like tree maps do away with generating scale and just only focus on drawing the choropleth map data on a SVG canvas , a d3 object was used in combination with a select method to gain access to the svg element, two requests were made to two JSON data which is the data that will be used to draw the choropleth map on the SVG canvas, these data are brought into the application using the d3.json() method afterwards .then() promise is used to resolve the incoming data in a way it can be used.
One JSON data contains data on the percentage of bachelors that are above 25 years as regards their population across all the counties in the United States of America while the other json data contains data on all counties that will display the percentage of bachelors.
Width and height was also added to give dimensions to the SVG canvas the map would be drawn on by using the d3 attr() method. A d3.geoPath() method is used with the counties JSON data was resolved earlier to create a new geographic path generator for counties in United States displaying the geographic map of United Sates as a result, then the colors are assigned to the county maps according to the percentage level of population of the bachelors that are above 25 years old as stated ealier.
. Lastly, a tooltip is also added in such a way that when a user hovers over any county map, all the data for that county displays to further make it easier for the user digest the information presented.
The process that went into building this project was very enlightening for me, a lot insights about visualizing data with a map using geoPath() method, while researching about it I learnt about new terms like Point, Multipoint, LineString, Polygon, MultiPolygon, GeometryCollection in the context of cartographic visualization.

Project Info

Visualize With A Choropleth Map is a web app around catographic data visualization made with the d3.js(Data-Driven Document) and couple of new methods, this project built within a span of 5 days, it a little long because of the new domain of visualizing data with a map.

  • Type of Project: freeCodeCamp Visualization Project Challenge
  • Project: Visualize With A Choropleth Map
  • Website: visualize-choropleth.netlify.app
  • Completed: April 2021
visualize scatterplot screenshot

This project is one of the freeCodeCamp data visualization project challenge to display(visualize) data via multitudes of models used to visualize data for data scientist, statiticians, economists, weather forecasters, models like bar chart, pie chart, scatterplot etc

Visualize With Scatter Plot project was built using a javascript library called d3.js(Data-Driven Document), which sole purpose is to visualize data.
A svg element was added to the HTML document which serves as a canvas to draw the dots across the axes based on the incoming data, a d3 object was used in combination with a select method to gain access to the svg element, afterwards an AJAX request was then established by creating a new XHR(XMLHttpRequest) object to be able to retrieve data from a url provided by freecodecamp to work with, and data from this url is in JSON(JavaScript Object Notation) format, AJAX allows you to request data from a server and load it without having to refresh the entire page. Width and height dimensions for the svg canvas was added using the d3 attr() method, then scales are generated for both the x and y axis so that the incoming data(data on cyclist athlete doping) to be visualized can fit in perfectly in the svg canvas, the x-axis features the year of the doping allegations on each athlete, while the y-axis features the time in minutes and seconds of the cyclist athlete.
The circle dots that will visualize the actual data is filled with two colors based on whether a cyclist athlete has a valid allegation or not according to the data coming from the url. The x and y axis is now drawn taking their respective scale values as an argument.
A tooltip is also added in such a way that when a user hovers over any circle dot, all the data for that dot displays.

Project Info

Visualize With Scatter Plot is a web app for data visualization made with the d3.js(data document driven), a javascript library created to display data for visualization purposes, this type of data visualization feature circles with different colors to represent the different properties of the incoming data.

  • Type of Project: freeCodeCamp Visualization Project Challenge
  • Project: Visualize With Scatter Plot
  • Website: visualize-scatterplot.netlify.app
  • Completed: April 2021
huddle landingpage screenshot

This project is a landing page concept created as a way to experiment with colors, layouts, fonts, and graphics that can achieve the best look and feel that will be pleasing to the eye and also stimulates trust and confidence in potential customers.

Huddle Landing Page is a responsive website that can adjust to various device screen sizes, from small phones, tablets, phablets to laptops and big screen desktops.
It was built with only HTML5 and CSS3 using semantic markup, CSS Grid and Flexbox, no libraries or frameworks was used.
The main purpose of creating this static website is to serve as an online marketing tool for individuals, companies and organizations trying to get leads in their sales funnel by clicking the REGISTER button which is the CTA(call to action) as the main goal here is for potential customers to register.
The pixel-perfect background image used is a SVG format type image which displays perfectly at any screen dimension, so the image used for mobile screen size can be used for larger screen size and still maintain its quality.

Project Info

I had to figure out the best way to display a perfectly rounded border line around the social media icons.
The easiest to achieve this is to make the height, width and border-radius the same pixel size.
A change in state can be observed with interactive elements like buttons when hovered and focused on desktop and mobile devices respectively.

signup form screenshot

This project is a landing page with a sign up and introductory component to it another online marketing tool that ensures clarity when prospects are trying to figure what the website is all about, which is providing access to quality content on how a programmer solves a problem.

It is another static website built with HTML5, CSS3 and plain JavaScript, no frameworks or libraries because it was not needed, since it is small scale project using any framework or library would have been an overkill and also using frameworks and libraries too much makes a web developer lazy.
The website was built a mobile-first approach which is a best practice for developing a responsive website, this approach usually involves creating an optimal website layout best for mobile screen sizes first, then readjusting the layout using CSS media queries and CSS Grid to make the website layout display optimally on bigger screen sizes.
The form for prospects to register to claim a free trial has a client side validation, this is make that no user submits the form if any of the input fields is empty and also ensures that the email address is formatted correctly, if any of this conditions are not met a red error message is displayed under the corresponding input field telling the user what is wrong with the form, only after the error has been corrected is the message removed.

Project Info

The process of creating this project helped me deepen my knowledge on client side validation for forms which is very essential in preventing redundant and useless data from being sent to the server, another kind of validation that can ensure an all round secure website because data sent from the client side(browser) can be manipulated in many ways beating any validation checks.

quote generator screenshot

This project was created as a concept to push my limits on learning and implementing React as one of the most efficient frameworks in the tech community.

Random Quote Generator apply the use of React Hooks useState and useEffect, using the tools made me appreciate how much React is improving.
The useEffect is combination of componentDidMount and componentUpdate, so instead of having type this two separately, all I just did was type the useEffect in one line and still accomplish my goal, the same with the useState method.
The web application was created in a way that when users click on a button called 'New Quote' a fresh quote is displayed together with the person that said the quote.
The user can also tweet the current quote to Twitter with twitter icon button or share it to Tumblr with tumblr icon button.

Project Info

Random Quote Generator is a web app made with the Facebook javascript framework React.

  • Type of Project: freeCodeCamp Frontend Libraries Project Challenge
  • Project: Random Quote Generator
  • Website: quote-spawn-machine.netlify.app
  • Completed: May 2019
motion picture app

This project was inspired by Florin Pop's 10 projects 10 hours. Building 10 react based projects in 10 hours. It is an excellent idea to sharpen skills with React.

Motion Picture App is a react based application built as a kind of database for all types of movies known to humanity right from the first movie that was ever created.
The MovieDB API was consumed to get access to movie data like movie overview, movie release date, movie title, movie theatrical poster, movie faetured actors and actresses and movie ratings. Movies can also be searched for by just typing movie title into the search and press enter, the MovieDB search API will then fetch movies that matches particular movie title keyword that was entered and the Fetch API communicates with the Search API in backend database, then ultimately displays its on the page for user's consumption.
The ratings also have different colors for a certain range of rating. Green is ratings over 8, Amber is for ratings between 6 and 8, while red is for ratings below 6.

Project Info

Motion Picture App is a web application built with React and plain CSS for styling that displays all kinds of movies, both classic and modern, greatest and mediocre movies all in one place. All you have to do is search for the movie you want.

Barchart Visualization

This project was created as part of the freeCodeCamp Data Visualization Frontend track using d3.js library.

Barchart Visualization is a web application built using HTML, CSS & JavaScript library(d3.js) which is used for visualizing data.
The purpose of data visualization is make it easy for people interested or in need of statistical data to be able to consume the data and make sense of it. The data sets which is the Gross Domestic Product of the United States from the year (1950 -2015) was consumed as an API asynchronously from a GitHub gist raw, then the data was returned as JSON object and was interacted with using AJAX deal with the data asynchronously. Scales for both X-axis and Y-axis were created using the scaleTime() and scaleLinear() methods respectively, then Gross Domestic Product which was estimated in Billions on Y-axis, and then the year was on the X-axis.

Project Info

Barchart Visualization is data visualization project created to visualize the Gross Domestic Product of the United States from the year 1950 - 2015.

Drum Machine

This project was named drum color machine because it makes sound and changes the background color randomly when any of the button is clicked or tapped on the keyboard.

A React based application inspired by freecodecamp front end library.
The web application was built with goal of having users click buttons on the screen, and as a result triggers the audio clip attach to the button to play variety of drum sounds.
Users can also tap the corresponding keyboard keys on the screen to trigger the audio clip to play.
Random color is also displayed at the background of the screen when either the keyboard keys are tapped or clicked on the screen.
The name of the drum instrument that is played through the audio clip when the buttons are clicked in displayed in a white box to inform user of the kind instrument that was just played.

Project Info

Drum Color Machine a web application built with Facebook React that makes sound and changes color when corresponding keyboard key is pressed or clicked.

  • Type of Project: freeCodeCamp Frontend Libraries Project Challenge
  • Client: Drum Color Machine
  • Website: sound-color.netlify.app
  • Completed: July 2019
Markdown Previewer

The markdown parser was again inspired by the freeCodeCamp front end library project path. An online markdown parser where anybody can write a markdown syntax in one column and have it parsed in the other column.

This project was built with the React library used building for interactive user interface.
The application created with two input column in mind, one is where the markdown syntax will be written, then the other column is where the parsed markdown will be displayed.
I made sure that both columns are aligned equally in centre of the screen by using flexbox to centre the two columns horizontally and vertically.
The heigth of both columns were increased to like 85% of the screen to allow the user to be able to write as much markdown as possible.
The Google font Manrope was used as the font to add a better readability for the user's experience.
The markdown parser and compiler package markedjs was used to parse the markdown syntax into a readable format

Project Info

A markdown parser application that auntomatically parses a markdown syntax to a readable format.

  • Type of Project: freeCodeCamp Frontend Libraries Project Challenge
  • Client: Markdown Previewer
  • Website: markdown-displayer.netlify.app
  • Completed: Oct 2018
Todo List

Todo List App created with pure JavaScript to give users an opportunity an online todolist application that store their list of todos when needed.

Todo List App was built with vanilla JavaScript and Twitter Bootstrap framework to give it a responsive layout that will look good on any type of device screen size.
To start with, a text type input form was created to allow the user to type their todo or grocery list item inside, then this typed text in the input is saved to be rendered to screen under Items once the enter button on any device the user might be using is tapped.
User can also clear out the list if they want with the Clear All button, a confirm dialog comes up to ask user if they are sure or not.
Local Storage was also implemented in the app to make sure any item added to or removed from the screen stays that way even when the browser is refreshed.
This was integrated so that in a scenario where a user mistakenly close a tab or refresh a page, their data persists on the screen.

Project Info

A todo list app created on the web where people can list items they need to buy or things they need to do on a daily or hourly basis.

Calculator

A responsive web based calculator to make both simple and complex calculations.

This project was built with vanilla(pure) JavaScript, no frameworks no libraries just plain JavaScript.
It was created to further push my learning on JavaScript and also to experiment and try new things with CSS Grid of which the learning process was insightful and fun at the same time.
The CSS Grid was implemented in a way such that the grid of 6 rows and 4 columns was layed out,and the buttons on the calculator was arranged in a way that has the operator buttons(add,minus,multiply,divide) stacked on top of each other so that user can get to them easily without having to stress to much.
Goldenrod was used as the background color for the operator buttons to make them stand out. The same for the equal button too, to make it stand out. The black above where number 0 is displayed is where the result of the calculation will be displayed after clicking the equal button.

Project Info

JavaScript Calculator is a calculator web app made with pure javascript.

Pomodoro Clock

Pomodoro Clock is a timer used for time management when working or studying so that user can stay focused for 25 minutes, then followed by a 5 minutes interval break.

Pomodoro Clock app is a well known application one can find on people's phone which is usually used for time management. This app helps you stay focused for 25 minutes straight no distractions, the rule is if you get distracted you have start all from 25 mins.
This app has helped me stay productive on a daily basis. Although mine is a mobile application. This project however is web based application and was created for the same purpose it serves, to help user stay productive.
The application allow user to increase or decrease from the traditional 25 mins. The session start counting down second-by-second, then once it is done an audio clip plays to notify user that the session is done, then immediately the break session starts.

Project Info

Pomodoro Clock is another React based built solely for productivity purpose.

Lyric Finder

Lyric Finder was created to allow users to search for lyric of the favorite song so that they can sing along.

Lyric Finder is a web application that was created just for fun.
React library was used to create this application. A search bar component was created so that user type in their favorite to search for, then the song is displayed after Get Track Lyrics button is clicked.
Musixmatch developer lyrics API was integrated into web application. The API was consumed using axios to display top songs on the screen when user land on the website.

Project Info

Lyric Finder is web app that allow people to search for lyrics to their favorite songs.